The View From Wisconsin
Just a random set of rants from a Sports Fan from Wisconsin.

Tuesday, May 31, 2005
End of the Month Thoughts
- Larry Brown denying that he's heading to Cleveland after the season reminds me of his promises to "never leave Kanasas" and "stay in Philadelphia." As soon as I heard his assertion that he's not leaving, I said to myself, "he's already got a house picked out in Parma."
- I'm a bit non-plussed over hearing my Alma Mater won the NCAA Division III Men's Baseball title. I'm excited that they won, but I'm a little frustrated that I didn't get a chance to go up to Little Chute to see them do it. The first team to "run the table" and go undefeated in the tournament. Not bad.
- Card update: I'm still at 27k-plus cards, but I've added 2005 Topps Series 2 to my collection. And, I have a reasonably good idea as to what card is my MVC (most valuable card): 1956 Warren Spahn. If it didn't have the pen mark on it, it might be worth $100 or so.
- So, the guy who was #2 at the FBI was "Deep Throat", hey? Interesting, but not so much that I can die a happy man or anything. I mean, I honestly believed we'd never really find out who Woodward and Bernstein's source really was. I also remember from the book that he wasn't always right, either. It's a non-story. Yeah, it's nice to know who it was, but I'm not all warm and fuzzy now because of it.
- You know, eventually the press is going to figure out that it doesn't matter what Americans do, people in the Middle East are going to hate us. There are so many people out there who just want to kill you - just because you're an American. Until we all realize that, we're going to have national elections that will be divided.
- Has someone told Senator McCain to wake up and smell the coffee about that Drug Free Sports Act yet? Oh wait, maybe he's realized that caffeine is a banned substance, according to WADA.
- I'm still trying to figure out a way to display my multitude of hockey pucks that I've collected over the years. I've gone from just having them sit on my hockey card box to spreading them out on my bookshelf. I haven't really seen a puck display that would be able to take all of my collection and display it properly. If I had a little more patience (and some craftiness), I'd build a display myself.
Monday, May 30, 2005
Memorial Day
And for today's rants:
- Ms. Patrick had a pretty good run at Indy, but (predictably) she didn't win. However, her fourth place finish means she has momentum for 2006 - and hopefully by then the IRL/Champ Car mess will have been sorted out.
- So Lowe's Motor Speedway in Charlotte is now "a bigger Bristol"? Does that mean we'll see the winning car of a future race there sliding across the finish line sideways, like Terry Labonte did a few years back (courtesy of Dale Earnhardt)? I actually forgot what a NASCAR race telecast looked like - boy, do I miss ESPN's coverage of the sport.
- The Brewers played down to the competition again. The pathetic 'Stros won two out of three at Miller Park - and we didn't even see Roger Clemens. It's a matter of being consistent on offense for these guys; six runs one night, one the next, two the next.
- Don't you just love it that the Yanks/BoSox game was a battle... for second place in the AL East? Oh wait, that's right - it's the Orioles in first. Never mind - it's a travesty that MLB is kowtowing to Angelos, and basically drowning the Nats because Comcast is ticked at them. Of course, it would be some sort of poetic justice if the Nats and O's faced each other in the World Series... something that's never happened in baseball history.
- Unfortunately, I was unable to attend my sister's annual family picnic. My wife attended in my place, taking a friend's daughter along with for company. My current sets of body aches and pains (mostly due to my decision to try to count my card sets) have made sleeping during my "normal" times an adventure.
- "Italian Loose Meat Sandwiches." Yeah right. My wife's just trying to be "sensitive" about one of my least-favorite meals - and it's not just because they're more commonly known as "Sloppy Joes."
- Irony: Next week, on the one-year anniversary of the last NHL hockey game played, junior-age players and college kids will be working out at a rink in the T.O. area - not as part of some huge scouting combine, but as a "test facility" for NHL rule changes. Larger nets, smaller pads, no center red line... it'll be laboratory hockey. Let's hope it's not Frankenstein's lab, though.
- Idiocy: A New Jersey state assemblyman, who (coincidentally) is a Baptist deacon, has brought forth legislation requesting that, as a stipulation for accepting public funding for the new Newark Arena, the Devils change their name from their "satanic-sounding" moniker to something less evil-sounding. Now, let's get something straight: I am a Christian. I believe in God and the Bible and that. However, even I know that the reason for the nickname is the fictitious creature that supposedly roamed the swamps of Northern New Jersey that terrorized the citizenry in Revolutionary times. To suggest that a name change to something "less Satanic sounding" because they're accepting public money is moving a bit over the line between church and state. Thankfully, Lou Lamiorello's response was, essentially, "don't they have something better to do?"
- Everyone's upbeat about the NHL talks, figuring that they're a lot closer to the end than the beginning. There's still a whole bunch of ways they can mess it up, though - and this is the NHL we're talking about here. The ESPN decision didn't help - but do you get the feeling that there's something waiting in the wings when it comes to national TV in the US?
Sunday, May 29, 2005
A lot of cards
- 27,180 cards. That was the total once I finished with the last box of my collection. Cards from the first 1952 Topps set (okay, one card from that set) onward to a few packs of Pacific Hockey that I picked up last week. I have a set in particular that it will be my goal to finish out the set (my 1990 Score Baseball set, which consists of around 1,800 cards - but I'm missing 19).
- ESPN said goodbye to the NHL a long time ago. They just now got around to acknowledging it.
The NHL could have used the WWLIS, but they dropped the NHL just as the Gretzky era was taking off. The NHL could do better - and hopefully they will.
- Speaking of better - how would this be for conspiracy theorists? The NHL sets up a draft lottery that basically all but gives Sidney Crosby to the New York Rangers. He goes in, takes the league by storm - and the Rangers still don't make the playoffs. (laughing)
- Ben did not look good last night in his first start back. I've already got co-workers who are thinking the "curse of the Big Brewers Contract" is starting up again. Come on, people - it's his first start in over a month.
- As much as I'd like to see Danica Patrick beat the boys at the Brickyard, I can't help but think that she won't even finish the race. And as much as ABC is wanting the 500 to be a ratings success, it probably won't ever be the same as it was in the Foyt/Mears/Johncock/Andretti days.
- Speaking of the ladies, I've seen a couple of glowing articles about how the WNBA is "really taking off" now that there's going to be a team in Chicago next season. Yawn. I'd wager that Major League Soccer will last longer than the WNBA.
- And as for the game of "real football" - ManU chairman Sir Roy Gardner decided to step down after a few weeks of speculation. And, Nike is considering dropping their sponsorship of the club, because of the backlash from the anti-Glazer crowd. Even Vodafone, their primary "kit" sponsor, is considering dropping their sponsorship out of fear of fan backlash against their product. I still say that the MU fans should wait until the club takes the pitch next year - if they stink it up in the Premiership because of the takeover, then you might have something. Right now, all that boycotts are doing is just digging the hole for the team. And, even if they were to somehow convince Glazer to dump the team, they'd end up with nothing for all the money they've taken out. Someone really has to read these blokes some basic Econ.
- Every week that I've been thinking, "this is the week they get the deal done," the NHL and NHLPA trash my hopes. I still honestly believe that the framework is there, and the only thing that needs to be filled out is the numbers that will determine the caps, taxes and shared revenues. But the way they're going... (sigh)
Wednesday, May 25, 2005
Cards, cards, everywhere cards
Back in my sophomore year at Whitewater, a couple of dorm-mates who were big baseball card collectors convinced me to break up two of my Topps card sets, which I had a complete set of at the time. Unfortunately, the two cards happened to be rookie cards. And, double unfortunate, one of them is heading to the Hall of Fame this summer (and people in the Bronx think the other one should be in the Hall, too).
I have to give a huge shout out to Torch's Sports Cards, though - he helped me complete the two sets (for about the price I paid to buy the 1984 set way back when). I also got some 1984 Fleer Wax Packs (no, no Mattingly rookie in there - though it would have been justice), and some Donruss wax packs from 1985.
I also indulged in my NHL jones, getting a few packs of the 2005 Pacific set. Part of me wonders when/how the major manufacturers are going to put out a card set next year for the NHL, with stock pictures that are over a year old...
Sunday, May 22, 2005
Still Waiting
- I'm still waiting for that deal to finally get done. At least the players and owners have finally agreed on the fact that the sport's losing money.
- Can someone please tell congress to get the heck away from legislating penalties for drug use in professional sports? They've got a really bad track record when it comes to sticking their nose in the private sector.
- A small note to the people behind United Not For Sale: GET OVER IT. Glazer's not evil incarnate. You're being two faced over all of it. In the real world, there's only one team that can be owned by the fans, and it's about 120-some-odd miles due north of my location. Everyone else needs a sugar daddy.
- Once again, the Preakness shatters dreams of a Triple Crown winner. Though, I must admit, that was a pretty good piece of jockeying for Jeremy Rose, basically pulling Afleet Alex up from a tumble and chasing down the horse that knocked him down, Scrappy T, and winning the race. I've read in the AP report that usually such maneuvers end up as rolls - which end up with a dramatically hurt jockey and a dead horse.
- When is Ben Sheets coming back off the DL again? These guys are really missing him and Davis being our one-two punch in the rotation.
Thursday, May 19, 2005
Rants on a Rainy Day
- Congrats to Mr. Turer for getting the AHL to vote him in as the new blood of the Admirals. Go get that Due Diligence done and sign the checks over.
- Wouldn't it be funny, speaking of hockey, if just as ESPN is set to tell Bettman that their deal is off for '05-06, he announces "lockout's over, we're making progress towards a deal, we'll continue working under the old contract until we get this done." It'd be almost comical to watch.
- Hopefully, Bob Goodenow will be able to tell Billy Hunter, "Watch that first step off the edge of the abyss, it's a doozy." And Bettman will tell his former boss likewise.
- I'm glad I'm not the only one who thought last week's CSI:LV episode stunk. Television Without Pity's reviewer spent more time analyzing minutae than she did actually relating the episode.
- Oh, sure, now Jeffrey Hammonds comes through in the clutch. WHERE WERE YOU FOUR YEARS AGO? We better salvage a split from these guys today.
- Yes, I actually am bidding on a Machester United "kit" - albeit an older one, with Beckham's old number 7 on it. Figure, what the heck? I can really tick off those people on the other side of the Atlantic. They deserve it for inflicting a certain ex-witch... er, I mean ex-wife on a friend of mine.
- Slowly, I am increasing my sports card collection. I now have a single card from every single season of NHL hockey since 1991. The rest of my "lost year", the 2001-02 season, will be arriving soon in bundles. I ordered all of the Nashville Predators cards from the Upper Deck Victory set from that year. Tomas The World Beater was the first card that arrived. Somewhat appropriate.
- Time to go beddy-bye. Sometimes working third shift has its bad side, but when it's rainy and cold out, it's somewhat heartening to know that you're going to bed while the rest of the world wishes it was back in bed.
Tuesday, May 17, 2005
Comment Abled
Saturday, May 14, 2005
THE FIFTH SHOOTER
A Proposal for the NHL
As the day draws nearer (we hope) that the NHL returns to the ice, it is obvious that the league will need to bring fans back to the game. There is a distinct need for the league to get fans interested in the game, and for fans to have a connection to the players out on the ice.
Among the many suggestions that have been forwarded about how the league can make the game more interesting is the use of the shootout to determine the winner in tie games. The shootout itself is an extremely polarizing issue among fans – either you love it or you hate it.
But what if you could do something that would not only get fans more interested in the game, but actually get naysayers to look forward to the shootout? And not only would you get fans interested, but they could actually win something – even if their team doesn't win the game?
That is where the Fifth Shooter Voting process would come in.
The most commonly used rule for the shootout is for each coach to name five eligible shooters (non-goaltenders) to a list after the completion of the game or overtime period. Those five shooters would alternate penalty shots with shooters from the other team to determine the game winner.
What the Fifth Shooter program does is this: it allows the fans, both in the arena and at home on their computer or cell phone, to vote for who they want to see as the "fifth shooter" on their team. The player that the fans select would be named to the list of the five shooters in the first round of the shootout.
So the coaches wouldn't be completely shut out of the process, they would be allowed to substitute one player for any one of the five shooters in the second round of the shootout. And, if the player selected as the fifth shooter is injured or otherwise ineligible for the shootout (i.e., due to unexpired penalty time or disqualification), the coach may choose his replacement.
The voting would go something like this: when the arena doors open for fans to enter, each fan can go to a table or electronic kiosk to receive their ballot. At the kiosk, they would swipe their ticket under a scanner or enter their seat location on the screen. Once their ticket is validated, they may choose one skater from the active roster on each team as their choice for the "Fifth Shooter." The screen will verify their selection by having them enter an alphanumeric code, and the kiosk will print out a receipt for their vote. If the fan doesn't want to bother with the kiosk, they can go to a table set aside for balloting and have a team representative enter the information for them. The receipt would have a printed photo of each player selected, and their current statistics, along with the seat location, date of the game and a verification number. Fans in the arena would only be allowed to vote once. Voting in the arena would end at the opening faceoff of the third period.
For fans at home, they can either vote via the internet at NHL.com, where the balloting would be similar to that of the All-Star Game, or via their cell phone. Fans would select the shooter from the starting lineups, and would verify their selection by either logging on to an account at fifthshooter.nhl.com, or by entering their name and e-mail address. The ballot would be validated in the same manner as with the kiosks: entering an alphanumeric code to prevent "automated" entries. Fans voting online would be limited to only five ballots per game; the user's IP address would be logged, along with their e-mail address or login information to prevent further votes. Voting online would not start until the opening faceoff, but would still end at the opening faceoff of the third period.
For cell phone users, they would be able to send a text message to a particular phone number. They would receive a detailed text message giving the caller an opportunity to choose the number of a player, and sending it in as their vote. Cell users would be limited to one vote per team, and restrictions on voting time would be the same as with internet users (from the opening faceoff to the beginning of the third period).
During the third period, all three tabulation methods would be counted, and the vote totals for each player counted in each area. To prevent abuse by people at the arena, results would be weighed 60/40 between the arena and the internet/text messaging votes, depending on the team. A player on the home team would have 60% of his final vote percentage come from the arena balloting, while 40% would come from the online ballots and text message votes. A player on the visiting team would have the reverse (60% online/phone, 40% in-arena). An example: Player A, who is on the home team's roster, receives 20% of the votes in the arena, but only 5% of the votes from the online/cell phone ballots. 60% of 20 is 12, and 40% of 5 is 2. 12 plus 2 equals 14% - the player's final vote total. In case of a tie, the player with more total combined votes wins the selection.
At the end of regulation time, the results of the Fifth Shooter voting will be announced to the fans. If the game does not end in a tie, the announcement will be made after the Three Stars of the game are awarded. If the game is tied, each coach will be notified of the individual chosen, and will have the entire overtime period to consider who else will be on their shootout list.
If there is a problem with the voting in any of the three areas – a power failure prevents the arena count from going forward, or there are problems with the internet or cell phone voting – the voting is suspended, and the coaches are notified at the end of regulation (if the game is tied) that they will be able to choose any six players for their shootout list.
The fan participation wouldn't end with the announcement of the shooter, however; regardless of whether or not the game goes into the shootout, one fan in attendance would have his/her name drawn (or seat number called) to win a prize package. The prize would be something tangible: free ticket to a future game, t-shirt, puck, set of trading cards, whatever.
Fans participating on the internet and/or via cell phone would be chosen at random to win a prize, either a free ticket to a future game, a t-shirt and/or some other prize, like access to a photo gallery or one week free access to online video clips of their favorite team.
If the game goes into the shootout, and the "Fifth Shooter" scores the shootout-winning goal, the fan in attendance will win a deluxe prize – an autographed jersey, use of an arena party suite for a future game, or some such prize.
The NHL could have a league-wide sponsor for the "Fifth Shooter" balloting (yes, I'm thinking Jack Daniels might have an inside track on this, but anyone could take it and run with it). Announcers could update the voting totals during the game, maybe keep track of a season-long "shooter voting" record. Perhaps teams could have special promotions for individual winners, like having a year-end drawing for a trip to either Las Vegas or the Stanley Cup finals.
The concept of fans having a say in who could potentially win a game is a piece of PR goodwill that the NHL could definitely use after the ridiculously long lockout.
Friday, May 13, 2005
Two Minds
On the one hand, I am upset over the failure of Team USA to take advantage of the NHLers at their disposal and get to the Gold Medal game against our Northern rivals in Canada.
On the other hand, that is Tomas Vokoun in net for the Czechs. And I have this vague recollection of him playing for this certain team long, long ago in a galaxy far, far away.
I guess it really doesn't matter, because of two primary reasons that go hand-in-hand with both thoughts:
First, the Worlds weren't televised in the US on ESPN or any other cable outlet. And second, that team that Tomas used to play for hasn't played a game in over a year. So it was basically, "out of sight, out of mind."
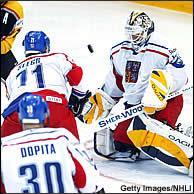 Sigh. He should be wearing mustard doing that.
Monday, May 09, 2005
Extended Racing Points
The idea came from the then-new Stock Car Racing Encyclopedia, Macmillan's attempt in 1996 to create a NASCAR version of their venerable Baseball Encyclopeda. In this tome, Peter Golenbock and Greg Fielden presented a simplified means of determining success as a driver: Performance Points. It wasn't anything new, of course; Fielden took the existing Formula One point system of awarding points for the top six finishers (10-6-4-3-2-1) and applied it to every driver in NASCAR's Grand National/Winston Cup series history.
Only one problem: if I wanted to actually go through and see who finished in sixth place for every single race over the past season, I'd be spending more time in front of the computer than I really wanted. So I made the first "adjustment" to the Performance Points system by awarding one point for all finishes from 6th through 10th. That way, all I would have to count would be the top-five finishers, and once I had those totals, simply subtract them from top-10 finishes as was commonly listed on nascar.com and other racing sites. This system is what I called Adjusted International Points, or AIP.
The idea was enough for a while, but as it came out in 2000 that NASCAR was seriously considering tweaking the system, I started to play around with AIP. I got a basic idea of what the Frances might want in terms of a points system: every driver gets a point for starting; bonus points for leading the race; winner should get more points than anyone else.
So I made some small changes to AIP: first of all, I wanted to extend the point awards out to the top 20 drivers in a given race. The concept was that if there wasn't much difference between finishing 21st and 43rd, the rolling wrecks wouldn't stay out there just to gain points. To do this, though, I had to bump up the award for finishing in the top 10. The simplest way to do that was to simply multiply AIP by 10 – that is, award 100 points for a win, 60 for 2nd, 40 for 3rd, 30 for 4th, 20 for 5th, and 10 points for each finish 6th through 10th. Then, you award 3 points for 11th through 15th place finishes, and one point for 16th through 20th.
To appease the promoters who want every starter to get at least a point in the standings, I added one point per start. This actually bumps the awards by one, but it's really a "bonus award" for the driver who starts the race. I also made the same decision that NASCAR did in 2004 – award an additional 10 points to the winner of the race.
Everything was going pretty well with this new system, with one exception: most of the major racing stats sites didn't include "races led" in their summaries, but instead gave "laps led." Thus, I had a difficult decision – how can I award points based on simply laps led and not by the NASCAR-traditional races led? The solution was an elegant compromise of sorts: if a driver leads a lap at any time during the season, he (or she) is awarded five points in the standings. For every 50 laps that the driver leads during the season, he or she gains an additional point in the standings.
For example, in 2000 Rusty Wallace led the most laps in the Winston Cup Series with 1,731 of his 9,925 completed laps. He got one point for that first lap he led, and 38 more for the remaining 1,730 he led, for a total of 39 bonus points. His AIP for 2000 was 73 (4-1-1-3-3-8), so that made for 769 points. Add his four wins, and he had 809 points. He had 25 top 15 and 26 top 20 finishes, so that makes for 825 points. Add his 34 starts to that total, and you have his final Extended Racing Points (XRP) total of 859. That was good for only fifth among Winston Cup drivers that season; Bobby Labonte ran away with the title with 1,120 points.
I'm obviously thinking I'm onto a good thing, here, and I think I even posted this to the rec.auto.sport.nascar newsgroup at one time. Then came a small argument among some of the posters on that vaunted newsgroup: what about pole positions? NASCAR has always been loathe to award points based on starting positions, mostly because of the rainout effect – the persons starting on the pole might be there because of their points standings, and not because of qualifying times, when there is a rainout of qualifying.
But there were those who were adamant about awarding something for winning the pole for a race. To be fair, I decided that the two drivers in the front row of most NASCAR races should split a 10-point bonus for posting the fastest two times in qualifying. The pole-sitter would get 6 points, and the outside pole-sitter would get four. To adjust for this in XRP, I changed the bonuses for 11-15 finishes to 6 points and 16-20 finishes to 3 points. This total, then, was what I called New Extended Racing Points, or NXRP. (When Nextel announced they were taking over as series sponsor from Winston, I decided that the N should probably mean "Nextel" instead of New.)
Of course, Nextel and NASCAR decided to go with the Chase for the Championship format in their last five races, which actually blew away an amazing season by Jimmie Johnson and teammate Jeff Gordon in 2004. Johnson racked up 1,511 NXRP, the single highest total since I began recording these points in 2000. What was ironic is that only two of the top 10 NXRP totals since 2000 were of drivers who won the Nextel/Winston Cup – and that was only Labonte and Gordon in the first two seasons (2000-01).
I honestly don't think it's a bad thing that NXRP deems another driver to be better, because the two systems are measuring different things. The correlations between the two point systems aren't that much out of whack: every single year had a correlation of .79 or greater between the two systems, with the new Nextel Point System for the Chase for the Championsip correlating at a five-year high of .86.
For those of you who didn't pay attention during math class, correlation is determining the relationship between two sets of numbers through a statistical formula. Theoretically, if every number in group A has a correlated number in group B, the two sets are considered to have a correlation coefficient of 1.0. Basically, the closer that coefficient is to 1, the greater the similarity between the two groups of numbers. Ideally, you would want the coefficient to be somewhere in the high 0.90's, but getting it to .86 is good enough in the real world.
I have not, as of yet, sat down and crunched the numbers for this season's Nextel Cup drivers. When I do, I'll post an update in a future entry.
Saturday, May 07, 2005
Why CYA and CYP Don't Always Match
1. The Winner Takes It All. (16 times: 1959, 1967 NL, 1971 NL, 1976 AL/NL, 1977 NL, 1980 AL, 1982 NL, 1983 AL, 1988 NL, 1990 AL, 1992 NL, 1993 AL, 1996 AL, 1997 AL, 2002 AL)
When pitchers are within a 10-point gap in CYP, and the only main difference between two or more pitchers is the number of wins, the pitcher with more wins will win the award over the lower win total. Usually, the reason why a pitcher with fewer wins has a larger CYP total is because of baserunner ratio - which is generally discounted by the BBWAA in selecting a Cy Young winner.
2. Relievers Are Often Misjudged By Voters. (9 times: 1960, 1974 NL, 1979 AL/NL, 1983 AL, 1987 NL, 1989 NL, 1993 NL, 2003 NL)
Relief pitchers have rarely been correctly chosen as CYA winners by the CYP method. Usually, a reliever who wins the award is only receiving it for achieving or setting some mark (Marshall, Sutter, Gagne) that is considered "outstanding" - when another pitcher should have been chosen. The 1979 season was unusual, in that the wrong league chose a reliever as its Cy Young winner; Joe Niekro had a distinctly better season with the Astros (21-11, 3.00 in 38 games, 119 K's and a 25.5 CYP total) than Sutter did in relief for the Cubs (6-6, 2.22 in 62 games, 110 K's and an 18.8 CYP) - but Sutter set the major league mark with 37 saves. Over in the AL, Jim Kern of Texas (13-5, 1.57 in 71 GP, 136 K, 40.6 CYP) had a distinctly better season than actual CYA winner Mike Flanagan of the Orioles (23-9, 3.08 in 39 GP, 190 K, 34.0 CYP). Flanagan, however, probably won the award because of another "quirk" of voting:
3. The Playoff Pitcher Takes It All. (7 times: 1962, 1967 AL, 1977 NL, 1985 AL, 1991 AL/NL, 1992 AL)
Basically, if two pitchers have CYP totals within 10 points of each other, the pitcher on the team that is in the post-season will win the award over the non-playoff pitcher. Jim Lonborg of the Red Sox won the 1967 AL Cy Young, even though Joe Horlen of the White Sox had a better winning percentage (.731 to .710), a lower ERA (2.06 to 3.16) and a better ratio (0.969 - ridiculous, even in the time of the pitcher, to 1.207). However, Horlen's White Sox faltered down the stretch - and the "feel good" story of Lonborg and the BoSox was too much for voters. There was one other reason why Horlen didn't get the nod as well:
4. Two Good Teammates Spoil The Vote. (5 times: 1967 AL, 1970 AL, 1986 NL, 1997 NL, 1999 NL)
If a team has two pitchers that are among the leaders in CYP, and there is a third pitcher whose CYP total is just a little less than one of the pitchers, but better than the other, it is highly likely that the third pitcher will win the CYA over the other two pitchers. The reason is simple: the argument over which of the two teammates is better gets thrown out, and the third pitcher gets the nod. Horlen's 1967 season was overshadowed somewhat by the tireless Hoyt Wilhelm, who was outstanding in the bullpen that year for the ChiSox.
5. Switching Leagues Mid-Year Doesn't Help CYA Voting. (3 times: 1966, 1987 AL, 1998 NL)
A trade in mid-season to a team in the other league, even if the pitcher performed well in both leagues, generally splits the CYA vote because neither league has seen him over an entire year. Randy Johnson, for all intents and purposes, should have been the NL Cy Young winner in 1998 over Tom Glavine of the Braves - but voters discounted the fact that he only had 11 starts in the NL (and that he was 19-11 overall between the two leagues). Randy winning the Cy Young that year wouldn't have set a precedent; Rick Sutcliffe actually went 4-5 for the Indians in 1984 before jumping to the NL with a 16-1 record (and 43.1 CYP). Randy's CYP total was 42.7 between the two leagues - enough that, if there would have been only one award handed out, he probably would have gotten it.
Pitching Performance and Cy Young Points
When you are attempting to measure the performance of a pitcher, you generally look at three key areas – decisions, earned runs and baserunners. Usually, a pitcher who does well in each of these three areas will be considered a heavy favorite for the Cy Young Award at the end of the season.
Statheads like myself have always had a nagging feeling that these three areas could be combined in some manner to produce a formula that would give some sort of measure of a particular pitcher's performance over a given time frame – month, season, career, whatever. Instead of just dealing with ERA and Wins, we want something more, something that gives us the overall picture in one stat or set of stats.
The Rotisserieans of the 1980's, in creating the game that has now spanned the globe to cause the fantasy sports explosion, used a little-appreciated tool to measure pitching performance. They gave it the less than elegant name "WHIP Ratio", indicating what exactly it measured: the ratio of walks and hits to innings pitched. Others have tinkered and toyed with it (Baserunners per Nine innings, for example), but the basic formula is powerful enough.
WHIP Ratio: (H + BB + HB) / IP
In trying to develop that "holy grail" of a pitching statistic, you realize quickly that you could very easily use winning percentage, ERA and Ratio to determine a pitcher's Efficiency – that is, the level of pitching performance you would expect of him in each of the three areas. Unfortunately, Winning percentage is a "positive" stat (you want it to be larger, not smaller), so to make it where all three measures are the same, we have to subtract it from 1 – essentially creating a "losing percentage." Average all three together and you have what is called Pitching Efficiency Ratio.
Pitching Efficiency Ratio: (1 – Winning Percentage + ERA + Ratio) / 3
Now, you should realize that PER won't be enough to separate the wheat from the chaff. If a pitcher didn't allow any baserunners in his only appearance, he'd have a PER of .333, unless he got credit for the win – in which case, it'd be .000. For example, Kenny Greer pitched in one inning for the New York Mets in 1993, striking out two in one inning without allowing a baserunner. He got the win, which means his PER is 0. That doesn't tell you much about his performance – other than the fact that he had one good inning in one game.
So, to compensate, we need to pair PER with a stat that shows some form of longevity – a counting stat that indicates both performance and sheer numbers. The best such stat for a pitcher is, obviously, wins. So, we divide wins by PER to get what I initially called Pitching Performance Points. The theory, of course, is that the more wins a pitcher has, and the lower his PER, the higher his PPP score would be.
Only one problem, though – it doesn't work well for pitchers whose win total doesn't reflect their contribution to their team. Take the following example from 1990:
- Doug Drabek 22-6, 2.76, 33 GP, 231.1 IP, 190 H, 56 BB, 3 HB, 1.076 Ratio, 1.351 PER, 16.3 PPP
- Dave Stewart 22-11, 2.56, 36 GP, 267.0 IP, 226 H, 83 BB, 5 HB, 1.176 Ratio, 1.357 PER, 16.2 PPP
According to our simple formula, Drabek had only a slightly better total (16.3) than Stewart (16.2) – but Drabek was clearly better with fewer losses, a better ratio and a lower PER. The forumla also doesn't work in Greer's case – one win, divided by zero, means an infinite result. Just using wins isn't enough; you need to express a pitcher's winning percentage as part of the our "performance counting stat."
Fortunately, Bill James actually came up with a way to do exactly this in his book, Whatever Happened To The Hall Of Fame? He stumbled upon a statistical anomaly of sorts, which he called Fibonacci Wins. His theory is, pitchers whose winning percentage is greater than .618 (the Fibonacci number) have a better Fibonacci Win total than someone with the same number of wins and more losses. Or, a 22-6 record is definitely better than a 22-11 record. The formula is simple:
Fibonacci Wins: (W x W%) + (W – L)
In our example, Drabek had 33.3 FW in 1990; Stewart had 25.7. This translates to a 24.6 PPP for Drabek, and 18.9 for Stewart. Though both had phenomenal years in 1990 – probably two of the best seasons a pitcher has had in the last two decades – Drabek was a distinctly better pitcher than Stewart that season.
There is one more stumbling point in our PPP formula – relief pitchers. Even the best reliever in the game won't get more than a handful of wins and losses in a season – if that. For them, the use of the Relief Points formula (the one used to determine the Rolaids Reliever of the Year Award) is the most logical choice.
Relief Points: (3 x SV) + (2 x W) – (2 x L) [– (3 x BS)]
A short note: because Blown Saves are a recent statistic, using them is optional in this formula. As long as you are consistent in how you figure the formula, you should be fine.
To strengthen the numerator in our PPP formula, we add Relief Points to Fibonacci wins, divide by two to average them, and then divide the result by PER. For individuals like Mr. Greer, all we need do is just divide the sum of his Relief Points and Fibonacci Wins by two. This formula actually works quite well for pitchers from the 19th Century, as the totals do a good job of expressing pitching performance of both "pinch" pitchers and your starting workhorses.
There is a distinct problem, however, in the modern era. Since 1951, the five best single-season pitching performances, using this formula, are Dennis Eckersley, 1990 (146.7); Jose Mesa, 1995 (104.3), Eric Gagne, 2003 (96.5), Trevor Hoffman, 1998 (94.0), and Eckersley again, 1992 (89.7). Care to guess what happened when we added Relief Points? We "over-weighed" our PPP formula in the favor of Relief Pitchers.
So, we need to adjust the totals so that all pitchers are on the same footing, in relation to the contribution towards a team's succes. The easiest way to do this is to adjust Relief Points downwards, based on the number of innings in which a pitcher has appeared. Thus, we take Relief Points, multiply by innings per game, and divide by nine – essentially adjusting RP by the percentage of a typical game that the pitcher appears therein. This resulting formula is one we will call Cy Young Points, as it is a relatively accurate measure of whether or not a pitcher is a credible candidate for the award in a given season.
Cy Young Points: [(RP x IPG/9) + FWP] / PER
In analyzing the data from every season going back to 1871, our previous iteration of the formula actually works better for pitchers from the pre-"Modern" era of 1901 to present. When we analyze individual players from those years, the innings per game adjustment is unnecessary, since pitchers completed games on a regular basis. That began to change as we entered the 20th century.
The best CYP season in the last 50 years, not surprisingly, was Denny McLain's 1968 season where he went 31-6 for the Tigers. With a PER of 1.013, his CYP total was an astounding 95.2. The only pitchers to come close since have been Ron Guidry (1978, 88.4), Dwight Gooden (1985, 85.9) and Greg Maddux (1995, 73.3). Sandy Koufax's stellar 1963 season (25-5, 306 strikeouts, 77.1 CYP) is the fourth best total since 1955. Koufax is the only pitcher to have four 50+ CYP seasons in the last five decades; from 1963 to 1966, he had CYP totals of 77.1, 58.0, 70.9 and 70.7. Juan Marichal is the only one to have more than three.
The obvious question, of course, is what pitchers have the highest career CYP totals. It'd be a pretty good guess if you said Cy Young himself; he is one of only three pitchers to have more than 600 CYP in his career with 655.0. Unfortunately, he is not the leader in his own category. That honor goes to Christy "The Big Six" Mathewson, who translates a 373-188 record with 28 saves, a ratio of 1.071 and a PER of 1.180 into a CYP total of 688.9 – the best ever in major league history. Interestingly, Al Spalding's totals over seven seasons comes in just behind Mathewson and Young, with 653.4. Spalding's numbers are magnified by his small 65-loss total.
The rest of the top 10 list isn't much of a surprise: Walter Johnson is fourth with 571.3; Grover Cleveland "Pete" Alexander is next with 560.7. The rest: Eddie Plank, 465.8; Kid Nichols, 463.3; Mordecai "Three Finger" Brown, 456.1; Robert "Lefty" Grove, 454.1; and John Clarkson (the 1880's pitcher), with 453.2. The highest modern-day pitcher is right behind them at 405.2, one Roger Clemens. Greg Maddux isn't far behind, with Tim Keefe (394.8), Warren Spahn (374.5) and Charles "Old Hoss" Radbourn (374.3) between him (352.8) and Clemens. The best true reliever, Hall-of-Famer Dennis Eckersley, is down at 22nd (319.3), wedged between Jim Palmer (325.9) and Tom Seaver (319.1). Randy Johnson is the only other current player with 300 or more career CYP, sitting at 26th with 302.1.
The worst pitcher in baseball history, according to CYP, was John "Happy" Townsend. He posted a 9-6 record in his rookie season of 1901 for the Phillies, with a decent 7.8 CYP total in 19 games – and never again had a positive CYP total in his remaining five seasons in the majors. He went to Clark Griffith's Washington club in 1902, where he promptly lost 16 games, had a 4.45 ERA, and posted a –7.5 CYP total. He followed that up with a 2-11 record in '03, with a 4.76 ERA, a 1.595 Ratio, and a –8.9 CYP.
That wasn't the worst of it, though: in 1904, he went a ridiculous 5-26 for the Senators, though his ERA dropped by a run. His CYP for the seasons was –29.5, the second-worst single-season total in baseball history. The worst came one season later, when Fred Glade posted a 6-25 record with the Saint Louis Browns. Coupled with a 1.602 PER, his CYP total of –33.8 is still the single-season record.
After one more terrible year with Washington (though not as bad as his 1904 totals), Griffith traded him to Cleveland in 1906. The new surroundings of League Park didn't help, as Townsend lost 7 of his 17 apperances. He was out of the majors by the end of the year. He would live to the ripe old age of 72, dying in his home state of Delaware.
Random Thoughts
- Steinbrenner's horse in the Derby was a lot like the Yankees over the last few years: looks good out the gate, comes down strong in the final turn, but disappears when it's down to the wire.
- There has GOT to be a time when Ned Yost has to consider sitting J.J. Hardy - for the good of the team. J.J. has not shown he is capable of handling big-league pitching, and with the Brewers not set in their offensive ways, it's time to give the spot to someone else. If that means Spivey and Hall up the middle, so be it.
- Whilst doing some channel surfing, I came across a tidbit: the 1953 Chevrolet Corvette was sticker-priced at $3,490. Using the US Consumer Price Index calculator, that would translate into $25,266.55 in 2005 dollars. The suggested list price of a 2005 Corvette? $44,510 (and that's the low end).
- Really nice of President Bush to notice that the US's inaction caused five decades of repression in the Baltics. However, he should have also pointed out that any action on the part of the US would have extended WWII by about... oh, 10 to 20 years. (And the Baltics would have been glowing at some point during that time.)
- All the crud that's coming out about the former American Idol contestant to ABC sounds more and more like sour grapes. I've never cared much for the show, and I'm thinking it's a lot closer to the end of its shelf life than the beginning. So I'd only have this to say about the whole brou-ha-ha: In the end, does it really matter?
- I really need to get the rest of my website up to date. I haven't updated my "hotlist" since the Clinton administration, and the likelihood that half the links on there are expired is very high. It's tough being one of those who got on the 'net back in the formative days.
- Every time I check my Google Mail, I'm getting a bunch of junk e-mails saying "we have been trying to contact you" and the vaunted "I need your help with a private matter." Sheesh.
- I am very, very disappointed that the BovineUnite.com website was nothing more than a viral marketing ploy for... the Maryland State Lottery? Cows in the state of Wisconsin are considering suing over defamation of character.
- Still no hockey. And trying to follow the IIHF Worlds is difficult when (a) no one's showing the games, and (b) there's a seven-hour time difference between here and Austria.
- By the way: Joe Nathan (27.3) and Dontrell Willis (19.1) are the current leaders in CYP.
Friday, May 06, 2005
What Will Happen
The NHL and the NHLPA will finally come to some sort of a centrist agreement – although heavily tilted in the direction of the league – and end this whole mess.
The players, now that they have given in on the one key issue of the owners – "Cost Certainty" – will have the rightful demand that the league engage in meaningful "Revenue Sharing" – and not just of monies from the Stanley Cup playoffs.
A tax threshold will be set, as will a cap level. Those numbers will be arbitrary in 2005-06, but will be a moving percentage beyond that. Tax revenues will be shared with low-revenue clubs – but with restrictions.
Other agreements will be made, along with the use of AHL rules from 2004-05, a committee that will look into goaltender pads and other possible rule changes, and the entry-level system.
The league will set up the whole proposal for a Board of Governor's meeting, to be held before June 1. Bettman will get the small-market "hawks" behind the plan, telling them they've gotten what they wanted in "cost certainty." The players will meet and ratify this less-than-perfect agreement, with Goodenow telling them that "it's the best we can do under the circumstance."
The two sides will sign the agreement, and an unusual announcement will be made: in conjunction with Hockey Canada and USA Hockey, the NHL and NHLPA will jointly sponsor two exhibition games between the players of the recently-completed IIHF World Championship squads for Canada and the US. The purpose of the games? To raise money for charity, and to promote goodwill to hockey fans in the US and Canada.
One of the games will be played Friday night, June 10, at Toronto's Air Canada Centre; the second will be played Sunday, June 12, in the afternoon at the St. Pete Times Forum in Tampa. During Sunday's game, the members of the 2004 Stanley Cup Champion Tampa Bay Lightning will be formally introduced and the Stanley Cup will be presented to them – along with the ceremonial raising of the 2004 Stanley Cup Championship banner.
The proceeds from the two games will be split between Hockey Canada, USA Hockey, NHL Charities and the NHLPA's Goals and Dreams Foundation. The NHL will share revenues with NBC/ESPN and CBC/TSN for the two games, with the NHL using the funds to pay the players for their appearance. Between periods of the game on Friday, the NHL will announce the draft order for the 2005 draft, and the "lottery" for the top 10 selections. Saturday, the league will hold its draft via conference call, with the announcement of the picks to be presented before the game on Sunday.
If it doesn't happen, there won't be hockey in 2005-06. In fact, the NHL will be dead before the end of the year, because the ensuing lawsuits will devour the league and its players.
Tuesday, May 03, 2005
NHL Negotiations: A Joke
A lecherous old man approaches a beautiful young lady and asks her, "What would you do for a million dollars?"
The beautiful young lady thinks about it, and tells the old man, "Why, there are many things I'd do for a million dollars."
The lecherous old man replies, "Well, would you sleep with me for a million dollars?"
The beautiful young lady is taken aback at first, but after some consideration and gentle persuasion by the old man, she relents and asserts that for a million dollars, she would indeed sleep with him.
The lecherous old man then replies, "So, would you sleep with me for one dollar, then?"
The beautiful young lady is taken aback by this proposal, and asks the lecherous old man, "My dear sir, what do you think I am?"
The lecherous old man replies with a smile, "Madam, we have already determined what you are, now we are merely haggling over a price."
And right now, dear sirs and madams, the NHL is simply "haggling over a price."
It appears, though, that "The Bettman" still doesn't trust the NHLPA completely. In a short interview in the Saint Loo Post-Dispatch (aka the Puke-Discharge), he hinted that he's not sure if the PA is sincere about trying to reach a cap number and structure both sides can live with.
We have gotten past the main sticking points that kept negotiations from moving forward for the last four years, with the players and owners now on the same page about a salary cap and about the financial numbers. Though there is a long way to go, there is a light at the end of the tunnel.
But like the "haggling" mentioned above, there is an overriding rancor that still lingers in the air between the two sides. Though the league stated that they will not seek to use replacement players, the PA is seeking recognition as a trade union in Quebec and British Columbia, essentially to block that as an option. Bettman and Daly have been soft-pedaling on the issue, saying that they may consider "all their options" at some future time.
What is truly at stake is the question of the money, to the chagrin of our beautiful young lady. Both sides realize that there is a deadline, where each side's economic status becomes of great concern to the other. The owners are eyeing June 1st, which is when ESPN is set to decide whether or not they shall continue to carry the NHL on "The Worldwide Leader In Sports" – or throw their lot in with Championship Poker and National Cheerleading Contests. That deadline can be a huge hit in the league's collective pocketbooks – which would drive their offer to the players down like a rock. The players have their own deadline, too: July 1st. That is the day that, technically, all contracts between the members of the NHLPA and the league would expire. Because of the default payment clause in the Standard Player Contract, the PA could essentially sue to have its membership collectively declared free agents.
That option would be a nuclear one of sorts for the PA, as it might cause more headaches than it would be worth. However, the headaches would be minor compared to the migraines NHL general managers would have in trying to resign an entire roster of players under a salary cap system. Flooding the market would make for a lot of unemployed hockey players – and a lot of overpaid hockey players, too.
The so-called "Hockey Insiders" that fill the Canadian and American press may not believe it, but the signs indicate that an agreement is sooner in coming than later. In fact, it wouldn't be at all surprising if a deal was completed well before Canada Day.
Then, the NHL can go back to being a hockey league – instead of the joke that it has become.
Copyright © 2004, 2005, 2006, 2007, 2008, Joseph Houk. All rights reserved.
